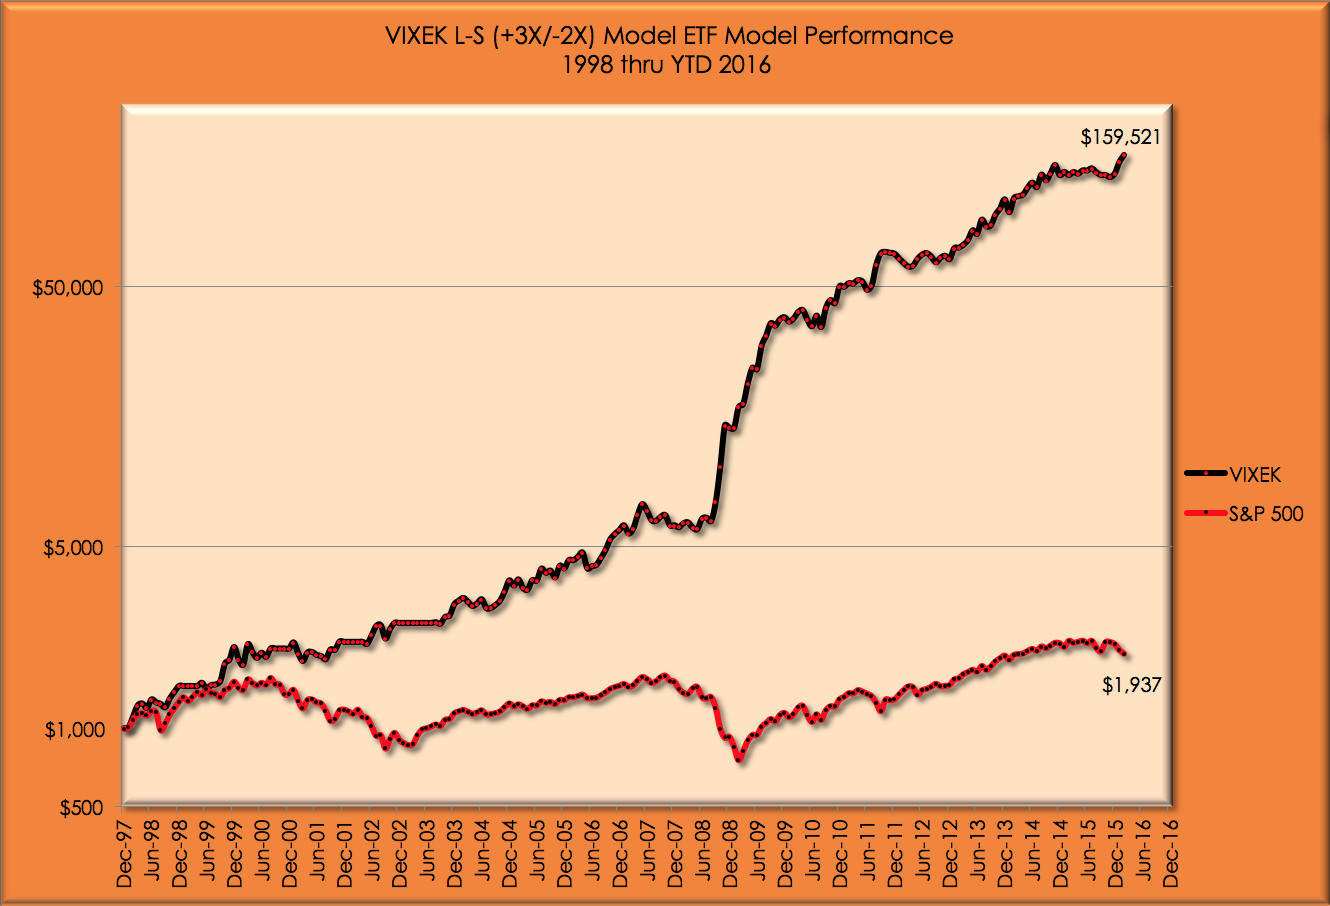
Performance of Long-Short Model Portfolio Driven Exclusively by VIXEK™
Upon realizing the power of VIXEK™ and its impact on "IRA" and "Unleveraged Long-Short (+1X/-1X)" model portfolios, we decided to model another "Long-Short" strategy. And to make it more interesting, we allowed it to use both bull (1X, 2X and 3X) and bear (1X and 2X) leveraged ETFs.
In other words, this model takes bullish or bearish positions, including leveraged positions if indicated by VIXEK™.
In this model portfolio also, we started on January 1, 1998 with all 95% of funds invested in an S&P 500 1X index ETF at the closing price of the previous trading day (12/31/1997).
Depending entirely and exclusively only on the latest VIXEK™ indicator, this model portfolio adjusts its position between 1X, 2X and 3X bull ETFs, 1X and 2X bear ETFs, and cash.
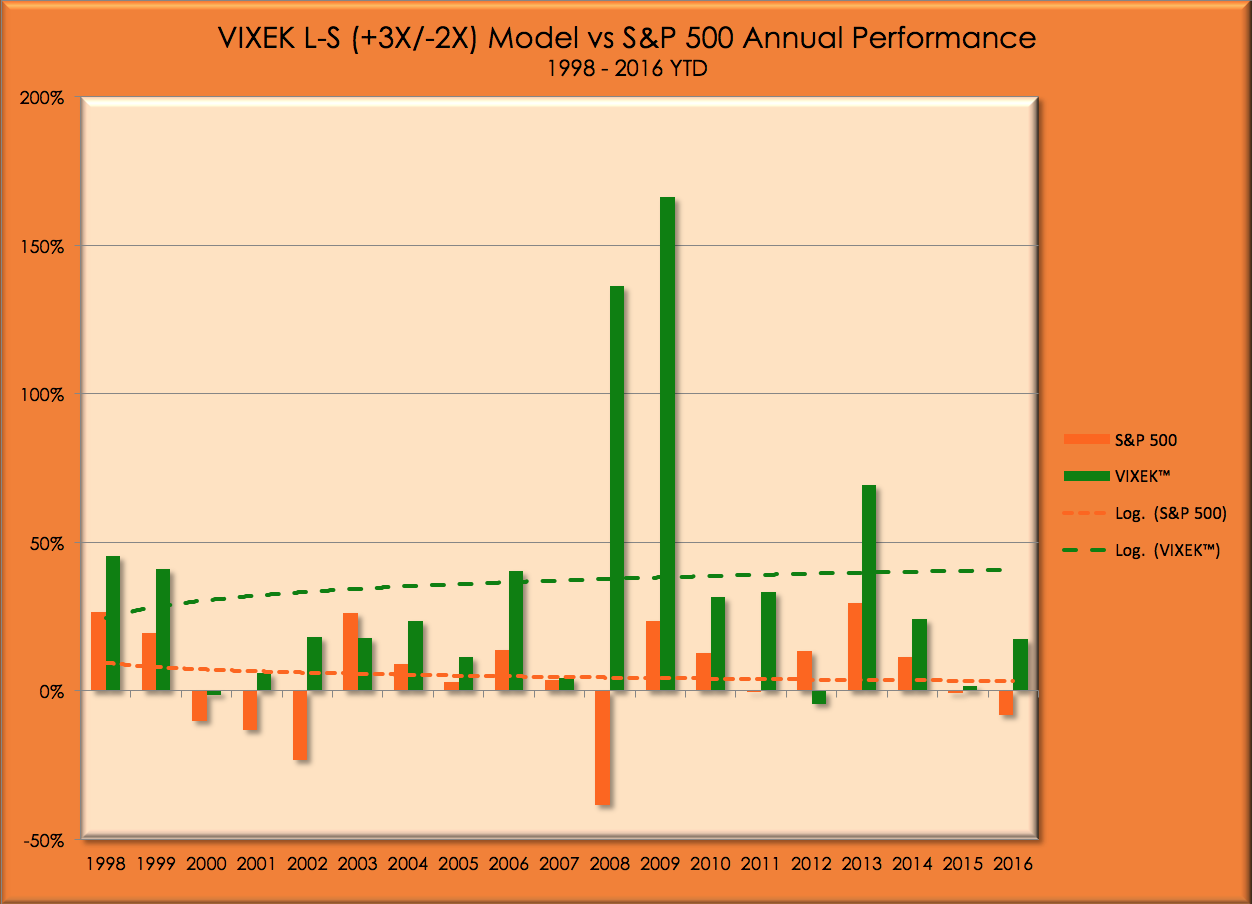
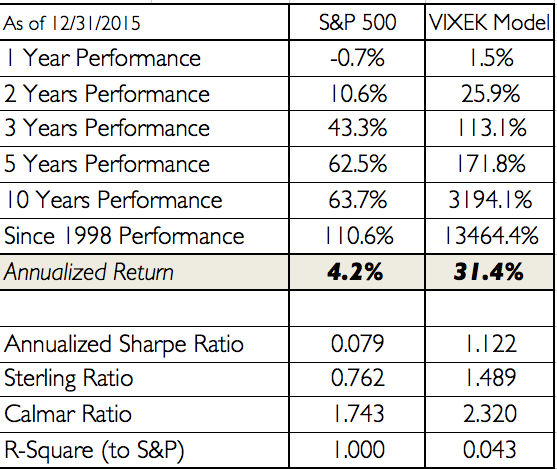
The performance of this model speaks for itself!
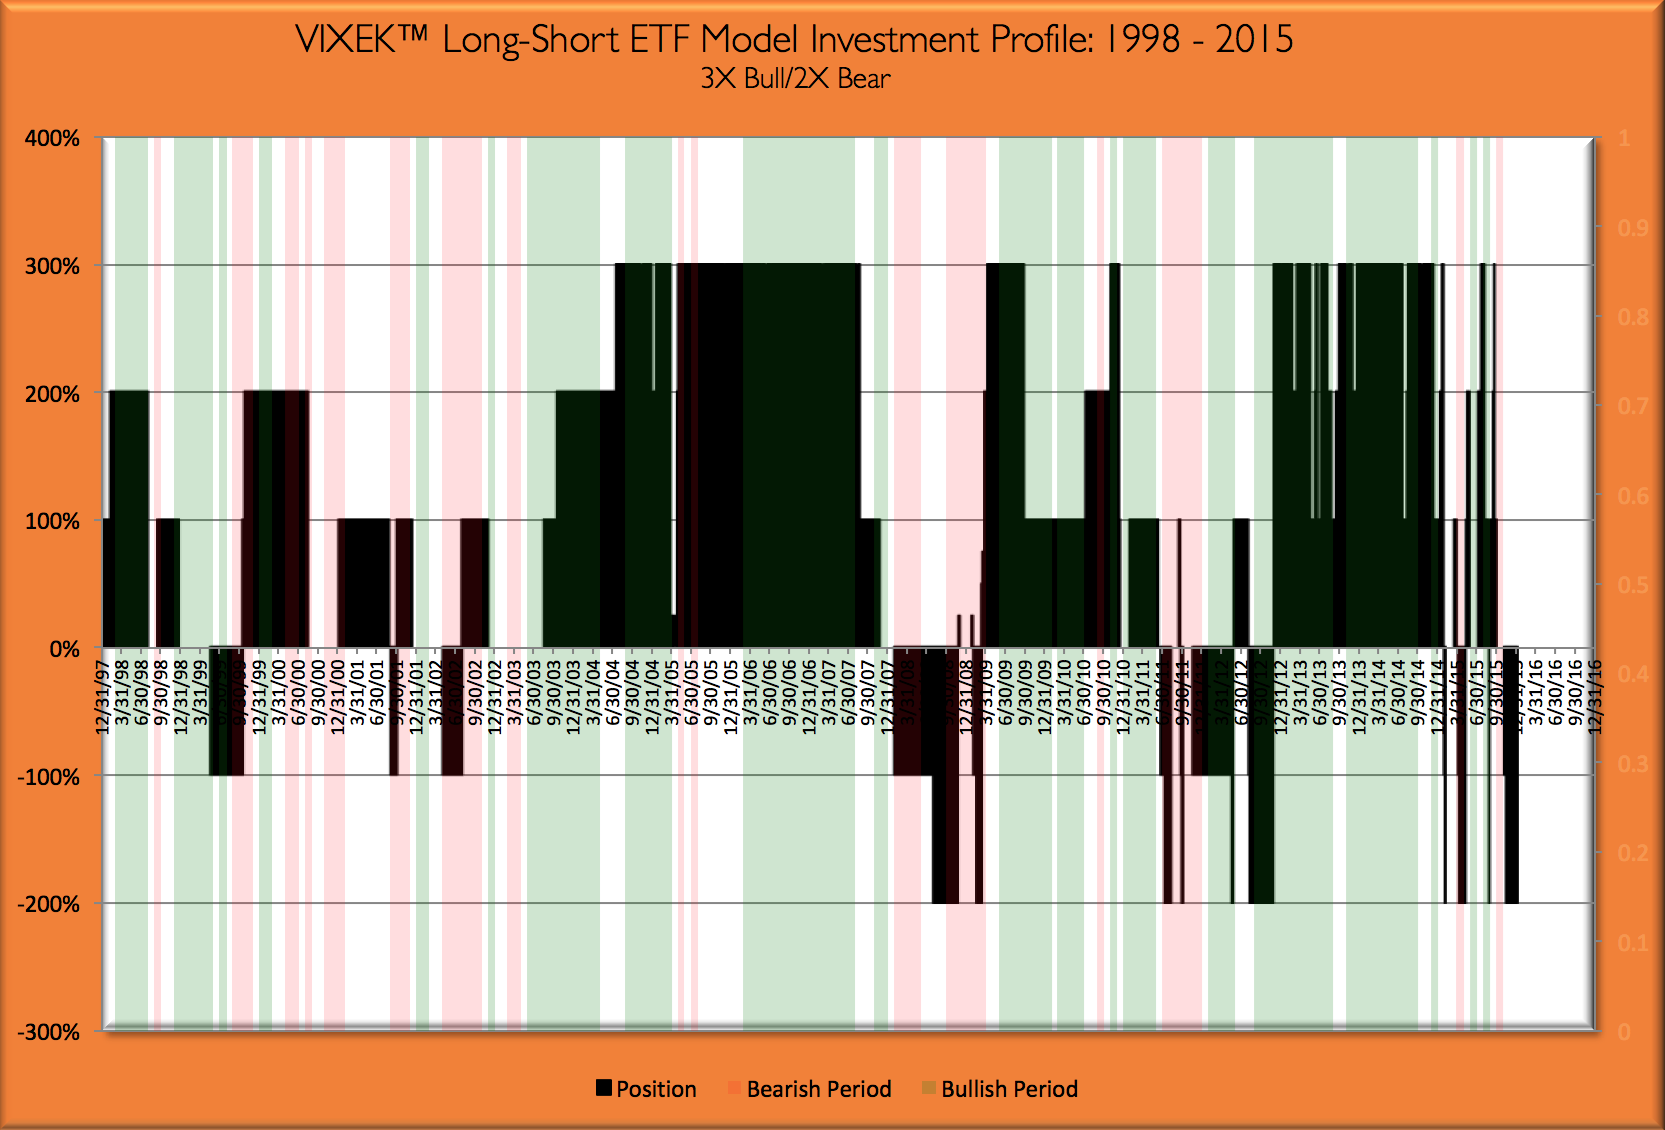
Dark bands above the zero line represent bullish investments, and dark bands below the zero line represent investments in inverse (bearish) ETFs. Light green bands represent bullish periods; light red bands represent bearish periods.
DISCLAIMER:
All performance data above is for a hypothetical Long-Short fund designed to simulate an actual fund investing in 1X, 2X & 3X bull and 1X & 2X bear ETFs and all reported results are before any transaction, management and performance fees.
Also, as is always the case, past performance is not a guarantee of future performance of similar or any other portfolio